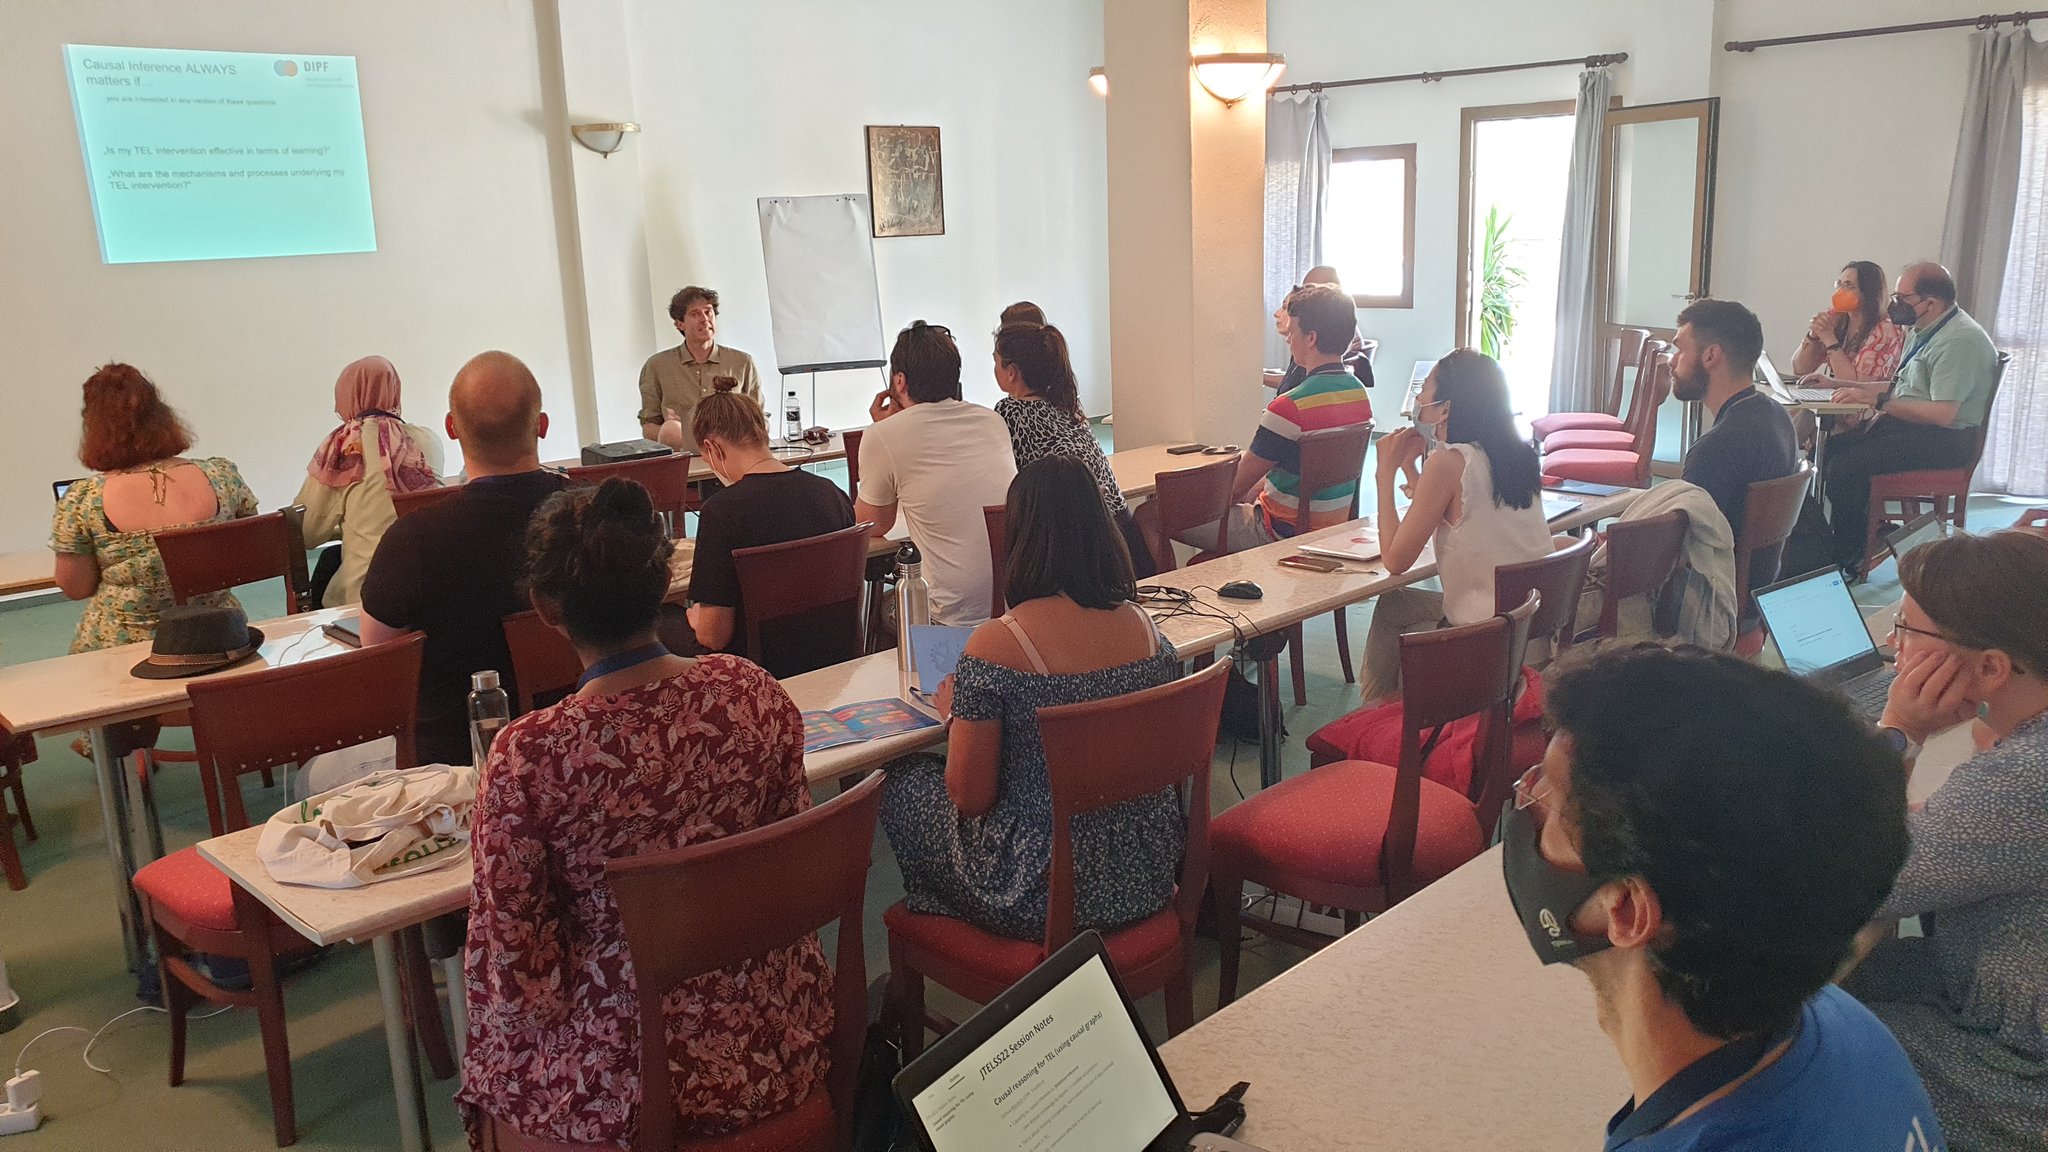
At this year’s JTEL summer school in Halkidiki, Greece (see previous blog post here), Joshua Weidlich presented a workshop on the topic of causal inference and causal graphs. The goal of this workshop was to equip young educational technology researchers with a toolkit for reasoning about causality and improving causal inference in their own research studies.

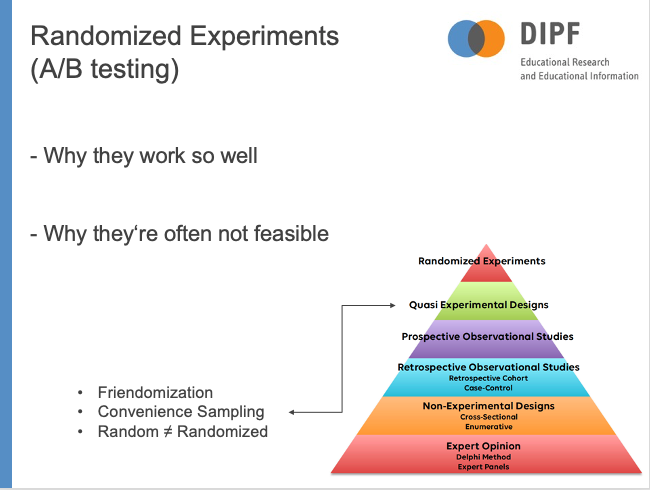
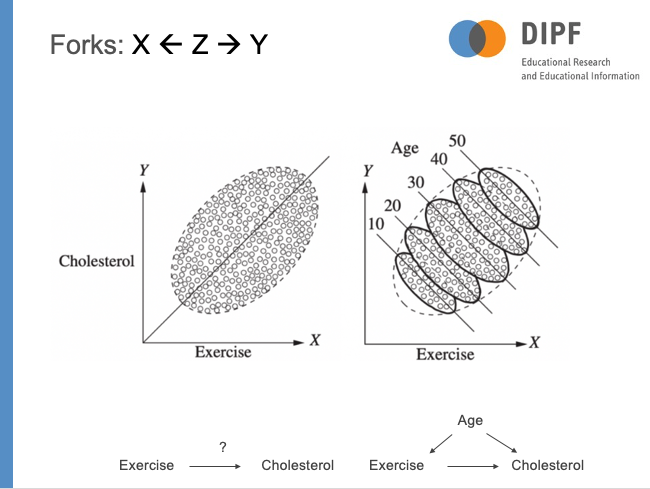
Central to this approach are Directed Acyclic Graphs (DAGs), simple visual structures that encode variables and hypothesized causal effects. The resulting graphs can then be inspected with a few simple rules to learn whether a) causal inference is possible, b) bias is present. After establishing groundwork by laying out why causal inference is central to most research endeavours, information about the unique features of randomized experiments was provided alongside major sources of bias (see slides below for examples).


In the final phase of the workshop, attendees formed small groups and were provided with an online-tool and three basic rules to construct their own causal graphs. From this, they derived practical information about how to design their studies, which variables to measure and control for.
