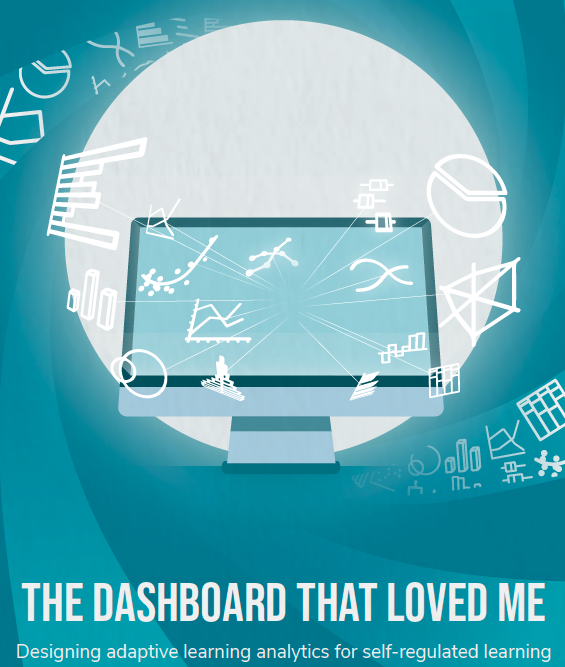
The impact of technology in improving educational opportunities has grown significantly in the last decade. Especially in 2020, when the corona crisis led to an unprecedented growth in online education for all ages. Online learning environments are equipped with all kinds of possibilities to generate feedback, based on educational data, the learning analytics. Ioana Jivet investigated how learning analytics can be used as a feedback tool in online learning environments. What are relevant aspects in the design of the online learning environment? And what information should the dashboard display in order to optimally support the learner in the learning process?
Ioana Jivet defends her thesis ‘The Dashboard That Loved Me: Designing adaptive learning analytics for self-regulated learning’ at the Open University on Friday 26 March 2021 at 1.30 pm (online).

Dashboard with relevant information
Ioana Jivet conducted qualitative research among students and observed the decisions that students make in a dashboard that they can set up themselves in a natural learning environment. Learners normally receive information on learning analytics via this dashboard in the online learning environment. In it, various indicators of the learner and the learning process are visualised with graphs. The purpose of such applications is to make learners aware of their learning process and to support them in gaining new insights. In this way, they can prepare themselves for the next step. A major challenge in the design of such tools is to ensure that they provide relevant information to learners. And this information must be presented in an intuitive way so that students can easily interpret the data.
Educational needs and user-friendly interfaces
The conclusions of the study show that the design of a dashboard goes beyond design choices in the type of graph and colours. A dashboard must combine complex educational needs with understandable and user-friendly interfaces. Different fields of science, including psychology, behavioural change, data visualisation and human-computer interaction, are needed to arrive at a good design. Pedagogical concepts should feed the purpose behind building a dashboard and guide decisions on how to provide feedback. Data visualisation and principles of human-computer interaction provide advice on optimal ways to build student interfaces.
Promotion Ioana Jivet
Ioana Jivet (1989, Timisoara, Romania) wrote her PhD thesis at the Faculty of Education Sciences of the Open University.
She defends her thesis ‘The Dashboard That Loved Me, Designing adaptive learning analytics for self-regulated learning’ on Friday 26 March 2021 at 13.30 (online) at the Open University in Heerlen.
Her supervisors are Prof. Dr. H.J. Drachsler, Open University, DIPF I Leibniz Institute & Goethe University Frankfurt am Main; Prof. Dr. M.M. Specht, Delft University of Technology. Co-supervisor is Prof. Dr. M. Scheffel, Ruhr-Universität Bochum.
The PhD ceremony can be followed live at www.ou.nl/live 
